COVID’s Impact on Airlines — A Flight Volume Analysis of 50 Top Airlines!
It’s been more than 18 months since COVID has hit the world. After a devastating year for airlines in 2020, many carriers try to return to a normal level. We wanted to know the details and analyzed the traffic volume of 50 top global airlines. Therefore, we compared each airline’s number of flights in June 2021 to the traffic level in June 2019.
Here’s what’s contained in detail:
- 1 – List of Airlines With More Flights Than Pre-COVID
- 2 – List of Airlines With More Than 90% of Flights Compared to Pre-COVID
- 3 – List of Airlines With 80% – 90% of Flights Compared to Pre-COVID
- 4 – List of Airlines With 70% – 80% of Flights Compared to Pre-COVID
- 5 – List of Airlines With 60% – 70% of Flights Compared to Pre-COVID
- 6 – List of Airlines With 50% – 60% of Flights Compared to Pre-COVID
- 7 – List of Airlines With 40% – 50% of Flights Compared to Pre-COVID
- 8 – List of Airlines With Less Than 30% of Flights Compared to Pre-COVID
List of Airlines With More Flights Than Pre-COVID
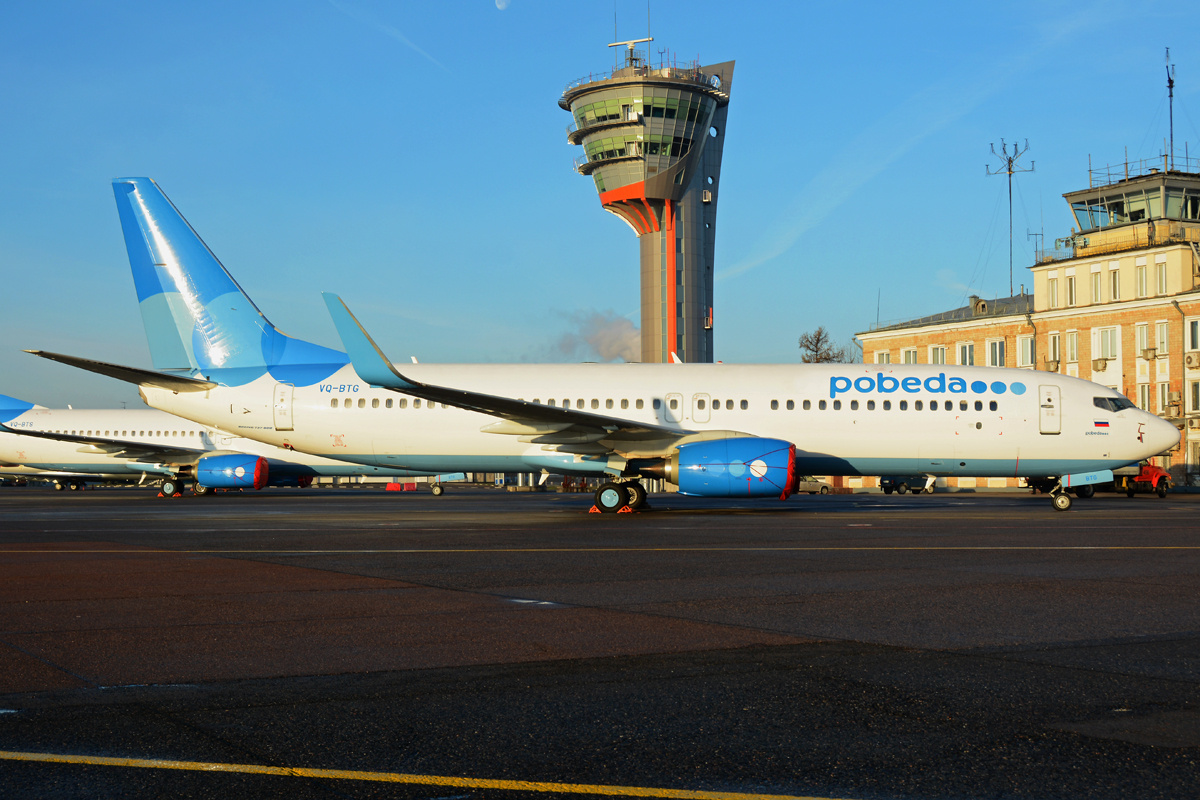
Out of 50 analyzed airlines, ten carriers managed to operate more flights in June 2021 than in pre-COVID time. Russia’s Pobeda definitely showed the most impressive performance. Compared to June 2019, Pobeda increased its flight volume by more than 54%. Ural Airlines is the second Russian airline among the top list. The Russian carrier increased its flight volume by almost 34%.
Moreover, three airlines from the United States managed to grow their flight volume compared to their pre-COVID level: Allegiant Air, Frontier Airlines, and Cape Air. Besides that, Mexico’s Vivaareobus operated almost 34% more flights. On top of that, it seems that U.S. airlines did a very good job: Allegiant, Frontier, and Cape Air operated more flights than in pre-COVID time.
| IATA | Airline | No. Flights June ’21 | No. Flights June ‘19 | Difference |
|---|---|---|---|---|
| DP | Pobeda | 7,894 | 5,124 | 54.1  |
| VB | Vivaaerobus | 8,305 | 6,201 | 33.9 |
| U6 | Ural Airlines | 6,749 | 5,502 | 22.7 |
| ID | Batik Air | 9,733 | 8,373 | 16.2 |
| G4 | Allegiant Air | 12,525 | 11,080 | 13.0 |
| F9 | Frontier Airlines | 13,449 | 12,149 | 10.7 |
| Y4 | Volaris | 12,701 | 11,601 | 9.5 |
| KC | Air Astana | 4,009 | 3,830 | 4.7 |
| 9K | Cape Air | 9,608 | 9,266 | 3.7 |
| MF | Xiamen Airlines | 19,777 | 19,408 | 1.9 |
List of Airlines With More Than 90% of Flights Compared to Pre-COVID
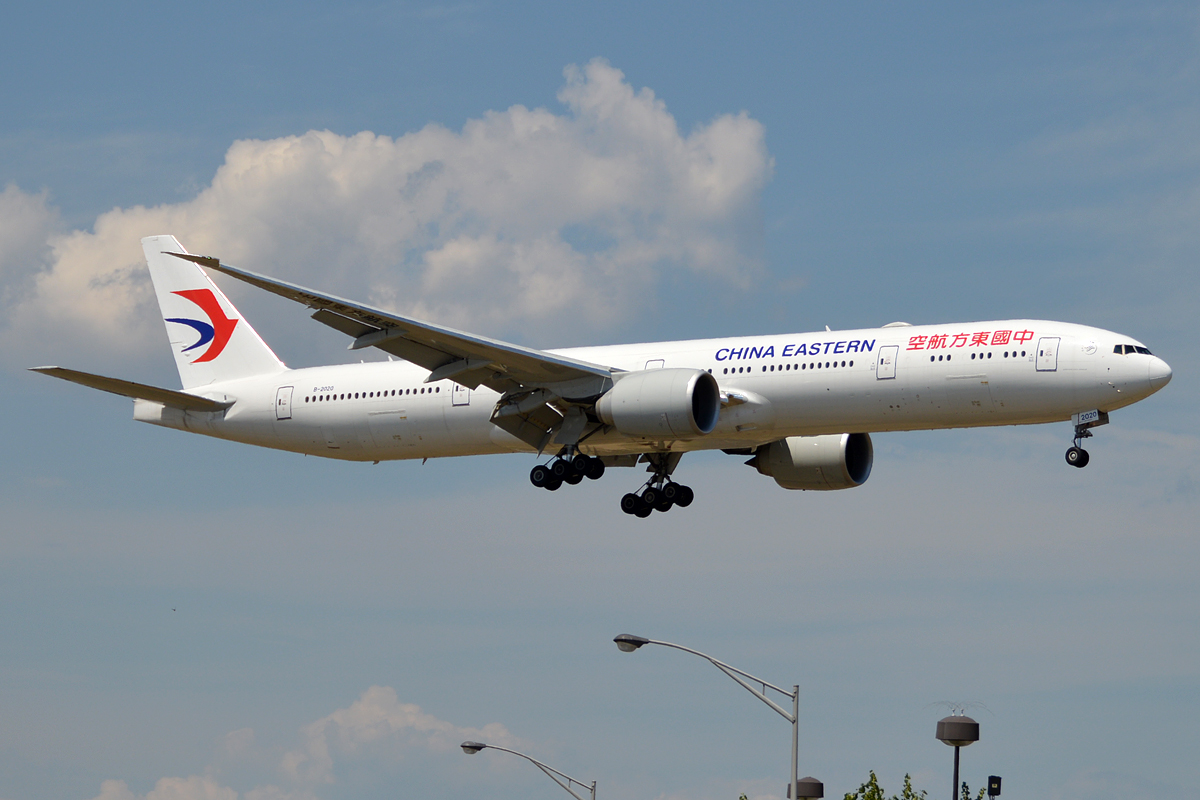
The following table contains airlines that are already pretty close to their pre-COVID flight volume level. With Go Air, China Eastern Airlines, and Air China, three out of seven airlines are based in Asia. However, even more, interesting to see that another two Russian airlines are on the list. Norwegian carrier Wiederoe represents the first European airline that is close to its pre-COVID flight volume.
| IATA | Airline | No. Flights June ’21 | No. Flights June ‘19 | Difference |
|---|---|---|---|---|
| G8 | Go Air | 8,051 | 8,260 | 2.5  |
| MU | China Eastern Airlines | 64,000 | 66,074 | 3.1 |
| CA | Air China | 39,243 | 41,342 | 5.1 |
| WF | Wideroe’s | 8,910 | 9,398 | 5.2 |
| NK | Spirit Airlines | 18,685 | 19,947 | 6.3 |
| UT | UTair | 6,728 | 7,207 | 6.6 |
| S7 | S7 Airlines | 12,609 | 13,764 | 8.4 |
List of Airlines With 80% – 90% of Flights Compared to Pre-COVID
The traffic volume of the below airlines is 10% – 20% short compared to pre-COVID flight volume. Nevertheless, it is amazing to see that American Airlines and Southwest Airlines are already playing in that league and operated more than 100,000 flights in June. Moreover, airlines from the United States again show a powerful performance.
| IATA | Airline | No. Flights June ’21 | No. Flights June ‘19 | Difference |
|---|---|---|---|---|
| AA | American Airlines | 173,464 | 203,582 | 14.8 |
| WN | Southwest Airlines | 100,689 | 118,372 | 14.9 |
| ZH | Shenzhen Airlines | 18,454 | 21,709 | 15.0 |
| NZ | Air New Zealand | 12,355 | 14,709 | 16.0 |
| AS | Alaska Airlines | 33,862 | 40,333 | 16.0 |
| ZL | Regional Express | 5,055 | 6,053 | 16.5 |
| QG | Citilink | 8,100 | 10,075 | 19.6 |
| B6 | JetBlue | 25,060 | 31,193 | 19.7 |
[rp4wp]
List of Airlines With 70% – 80% of Flights Compared to Pre-COVID
The following table contains airlines that are at a 70% to 80% pre-COVID traffic level. In that case, we have a mixed picture of airlines from South America, Africa, North America, Europe, and Asia. With Air France, we have the first major European airline on this list.
| IATA | Airline | No. Flights June ’21 | No. Flights June ‘19 | Difference |
|---|---|---|---|---|
| JQ | Jetstar Airways | 7,510 | 9,562 | 21.5 |
| JT | Lion Air | 12,644 | 16,225 | 22.1 |
| AF | Air France | 22,565 | 29,216 | 22.8 |
| PC | Pegasus | 12,012 | 15,567 | 22.8 |
| DL | Delta Air Lines | 129,989 | 171,638 | 24.3 |
| SU | Aeroflot | 23,877 | 31,650 | 24.6 |
| OA | Olympic Air | 4,804 | 6,390 | 24.8 |
| ET | Ethiopian Airlines | 7,489 | 10,118 | 25.9 |
| AD | Azul | 17,233 | 23,354 | 26.2 |
| AM | Aeromexico | 12,713 | 17,251 | 26.3 |
| HU | Hainan Airlines | 17,167 | 23,585 | 27.2 |
| HA | Hawaiian Airlines | 6,035 | 8,374 | 27.9 |
| QF | Qantas Airways | 15,835 | 22,136 | 28.5 |
| 7C | Jeju Airlines | 4,858 | 6,918 | 29.8 |
List of Airlines With 60% – 70% of Flights Compared to Pre-COVID
The below-shown airlines are hit considerably hard. Accordingly, their flight volume is between 30% and 40% below their pre-COVID level. Interesting to see that United Airlines shows the weakest performance of the big U.S. carriers.
| IATA | Airline | No. Flights June ’21 | No. Flights June ‘19 | Difference |
|---|---|---|---|---|
| V7 | Volotea | 4,911 | 7,200 | 31.8 |
| UA | United Airlines | 106,801 | 162,135 | 34.1 |
| SV | Saudi Arabian Airlines | 12,264 | 18,762 | 34.6 |
| XY | flynas | 3,732 | 5,736 | 34.9 |
| W6 | Wizz Air | 11,441 | 17,670 | 35.3 |
| QR | Qatar Airways | 9,738 | 15,163 | 35.8 |
| TK | Turkish Airlines | 26,174 | 42,283 | 38.1 |
| XQ | SunExpress | 3,398 | 5,602 | 39.3 |
List of Airlines With 50% – 60% of Flights Compared to Pre-COVID
With the worsening impact, the number of European airlines increases and U.S. airlines decrease. Iberia, KLM, and Ryanair are still almost 50% behind their pre-COVID level. Same accounts for Latin’s big players, such as Copa or LATAM.
| IATA | Airline | No. Flights June ’21 | No. Flights June ‘19 | Difference |
|---|---|---|---|---|
| JL | Japan Airlines | 14,418 | 24,839 | 42.0 |
| VA | Virgin Australia | 7,741 | 13,360 | 42.1 |
| IW | Wings Air | 6,400 | 11,236 | 43.0 |
| IB | Iberia | 10,393 | 18,532 | 43.9 |
| KL | KLM | 12,708 | 22,697 | 44.0 |
| LA | LATAM | 20,094 | 37,422 | 46.3 |
| CM | Copa Airlines | 5,333 | 10,141 | 47.4 |
| FR | Ryanair | 38,355 | 73,328 | 47.7 |
| NH | All Nippon Airways | 19,446 | 37,482 | 48.1 |
| MS | Egyptair | 3,621 | 7,087 | 48.9 |
List of Airlines With 40% – 50% of Flights Compared to Pre-COVID
The below airlines operated less than half of their pre-COVID flight volume. Although we have a mixed filled, European and Middle East airlines dominate the list.
| IATA | Airline | No. Flights June ’21 | No. Flights June ‘19 | Difference |
|---|---|---|---|---|
| FZ | flydubai | 3,033 | 6,083 | 50.1 |
| X3 | TUIfly | 1,883 | 3,792 | 50.3 |
| AV | Avianca | 10,089 | 21,334 | 52.7 |
| RJ | Royal Jordanian | 1,546 | 3,270 | 52.7 |
| VY | Vueling | 10,100 | 21,406 | 52.8 |
| A3 | Aegean Airlines | 2,267 | 4,883 | 53.6 |
| HV | Transavia | 2,565 | 5,600 | 54.2 |
| TP | TAP Air Portugal | 5,126 | 11,926 | 57.0 |
| LO | LOT Polish Airlines | 4,677 | 11,073 | 57.8 |
| 6E | IndiGo | 17,669 | 42,052 | 58.0 |
| G3 | GOL | 8,206 | 19,671 | 58.3 |
List of Airlines With 30% – 40% of Flights Compared to Pre-COVID
And now it’s getting really worse. The below airlines are between 60% – 70% down from their pre-COVID levels. And sad to see so many big players among the list: Emirates, Lufthansa, Singapore Airlines, or SAS.
| IATA | Airline | No. Flights June ’21 | No. Flights June ‘19 | Difference |
|---|---|---|---|---|
| SG | SpiceJet | 6,688 | 16,806 | 60.2 |
| OZ | Asiana | 3,201 | 8,314 | 61.5 |
| AI | Air India | 5,750 | 15,052 | 61.8 |
| GF | Gulf Air | 1,766 | 4,630 | 61.9 |
| EK | Emirates | 5,629 | 15,812 | 64.4 |
| AZ | Alitalia | 6,177 | 17,673 | 65.0 |
| LH | Lufthansa | 16,088 | 46,690 | 65.5 |
| EY | Etihad Airways | 2,539 | 7,446 | 65.9 |
| SQ | Singapore Airlines | 2,618 | 7,743 | 66.2 |
| GA | Garuda Indonesia | 4,496 | 13,346 | 66.3 |
| OS | Austrian Airlines | 4,344 | 13,038 | 66.7 |
| LY | El Al | 963 | 2,965 | 67.5 |
| SK | SAS | 7,660 | 25,359 | 69.8 |
List of Airlines With Less Than 30% of Flights Compared to Pre-COVID
Now we reached the bottom. The below airlines operate only 30% or less of their pre-COVID flight volume.
| IATA | Airline | No. Flight June ’21 | No. Flights June ’19 | Difference |
|---|---|---|---|---|
| KE | Korean Air | 3,933 | 13,318 | 70.5 |
| G9 | Air Arabia | 1,710 | 5,792 | 70.5 |
| LX | Swiss Air Lines | 3,915 | 13,544 | 71.1 |
| CX | Cathay Pacific | 1,998 | 8,292 | 75.9 |
| VN | Vietnam Airlines | 3,110 | 13,032 | 76.1 |
| EW | Eurowings | 5,246 | 22,145 | 76.3 |
| PR | Philippine Airlines | 2,420 | 10,395 | 76.7 |
| KU | Kuwait Airways | 621 | 2,709 | 77.1 |
| U2 | Easyjet | 12,310 | 55,999 | 78.0 |
| BA | British Airways | 6,714 | 31,948 | 79.0 |
| AY | Finnair | 2,304 | 11,137 | 79.3 |
| DY | Norwegian | 2,176 | 10,778 | 79.8 |
| 5J | Cebu Pacific | 1,814 | 9,371 | 80.6 |
| MH | Malaysia Airlines | 2,291 | 12,041 | 81.0 |
| WS | WestJet | 3,904 | 20,741 | 81.2 |
| AC | Air Canada | 8,615 | 47,680 | 81.9 |
| EI | Aer Lingus | 1,504 | 9,858 | 84.7 |
| WY | Oman Air | 825 | 6,203 | 86.7 |
Used Data
The shown information is based on OAG data and internal data sources. Rankings only included airlines that operated more than 500 flights in the respective month. However, the global benchmark includes all tracked flights. On average, 280 airlines are included in each month’s analysis. Whenever stated, EMEA refers to airlines based in Europe, the Middle East, or Africa.
What Do You Think?
We’re always happy to get your feedback. Just leave a comment below or get in touch with the author on social media.