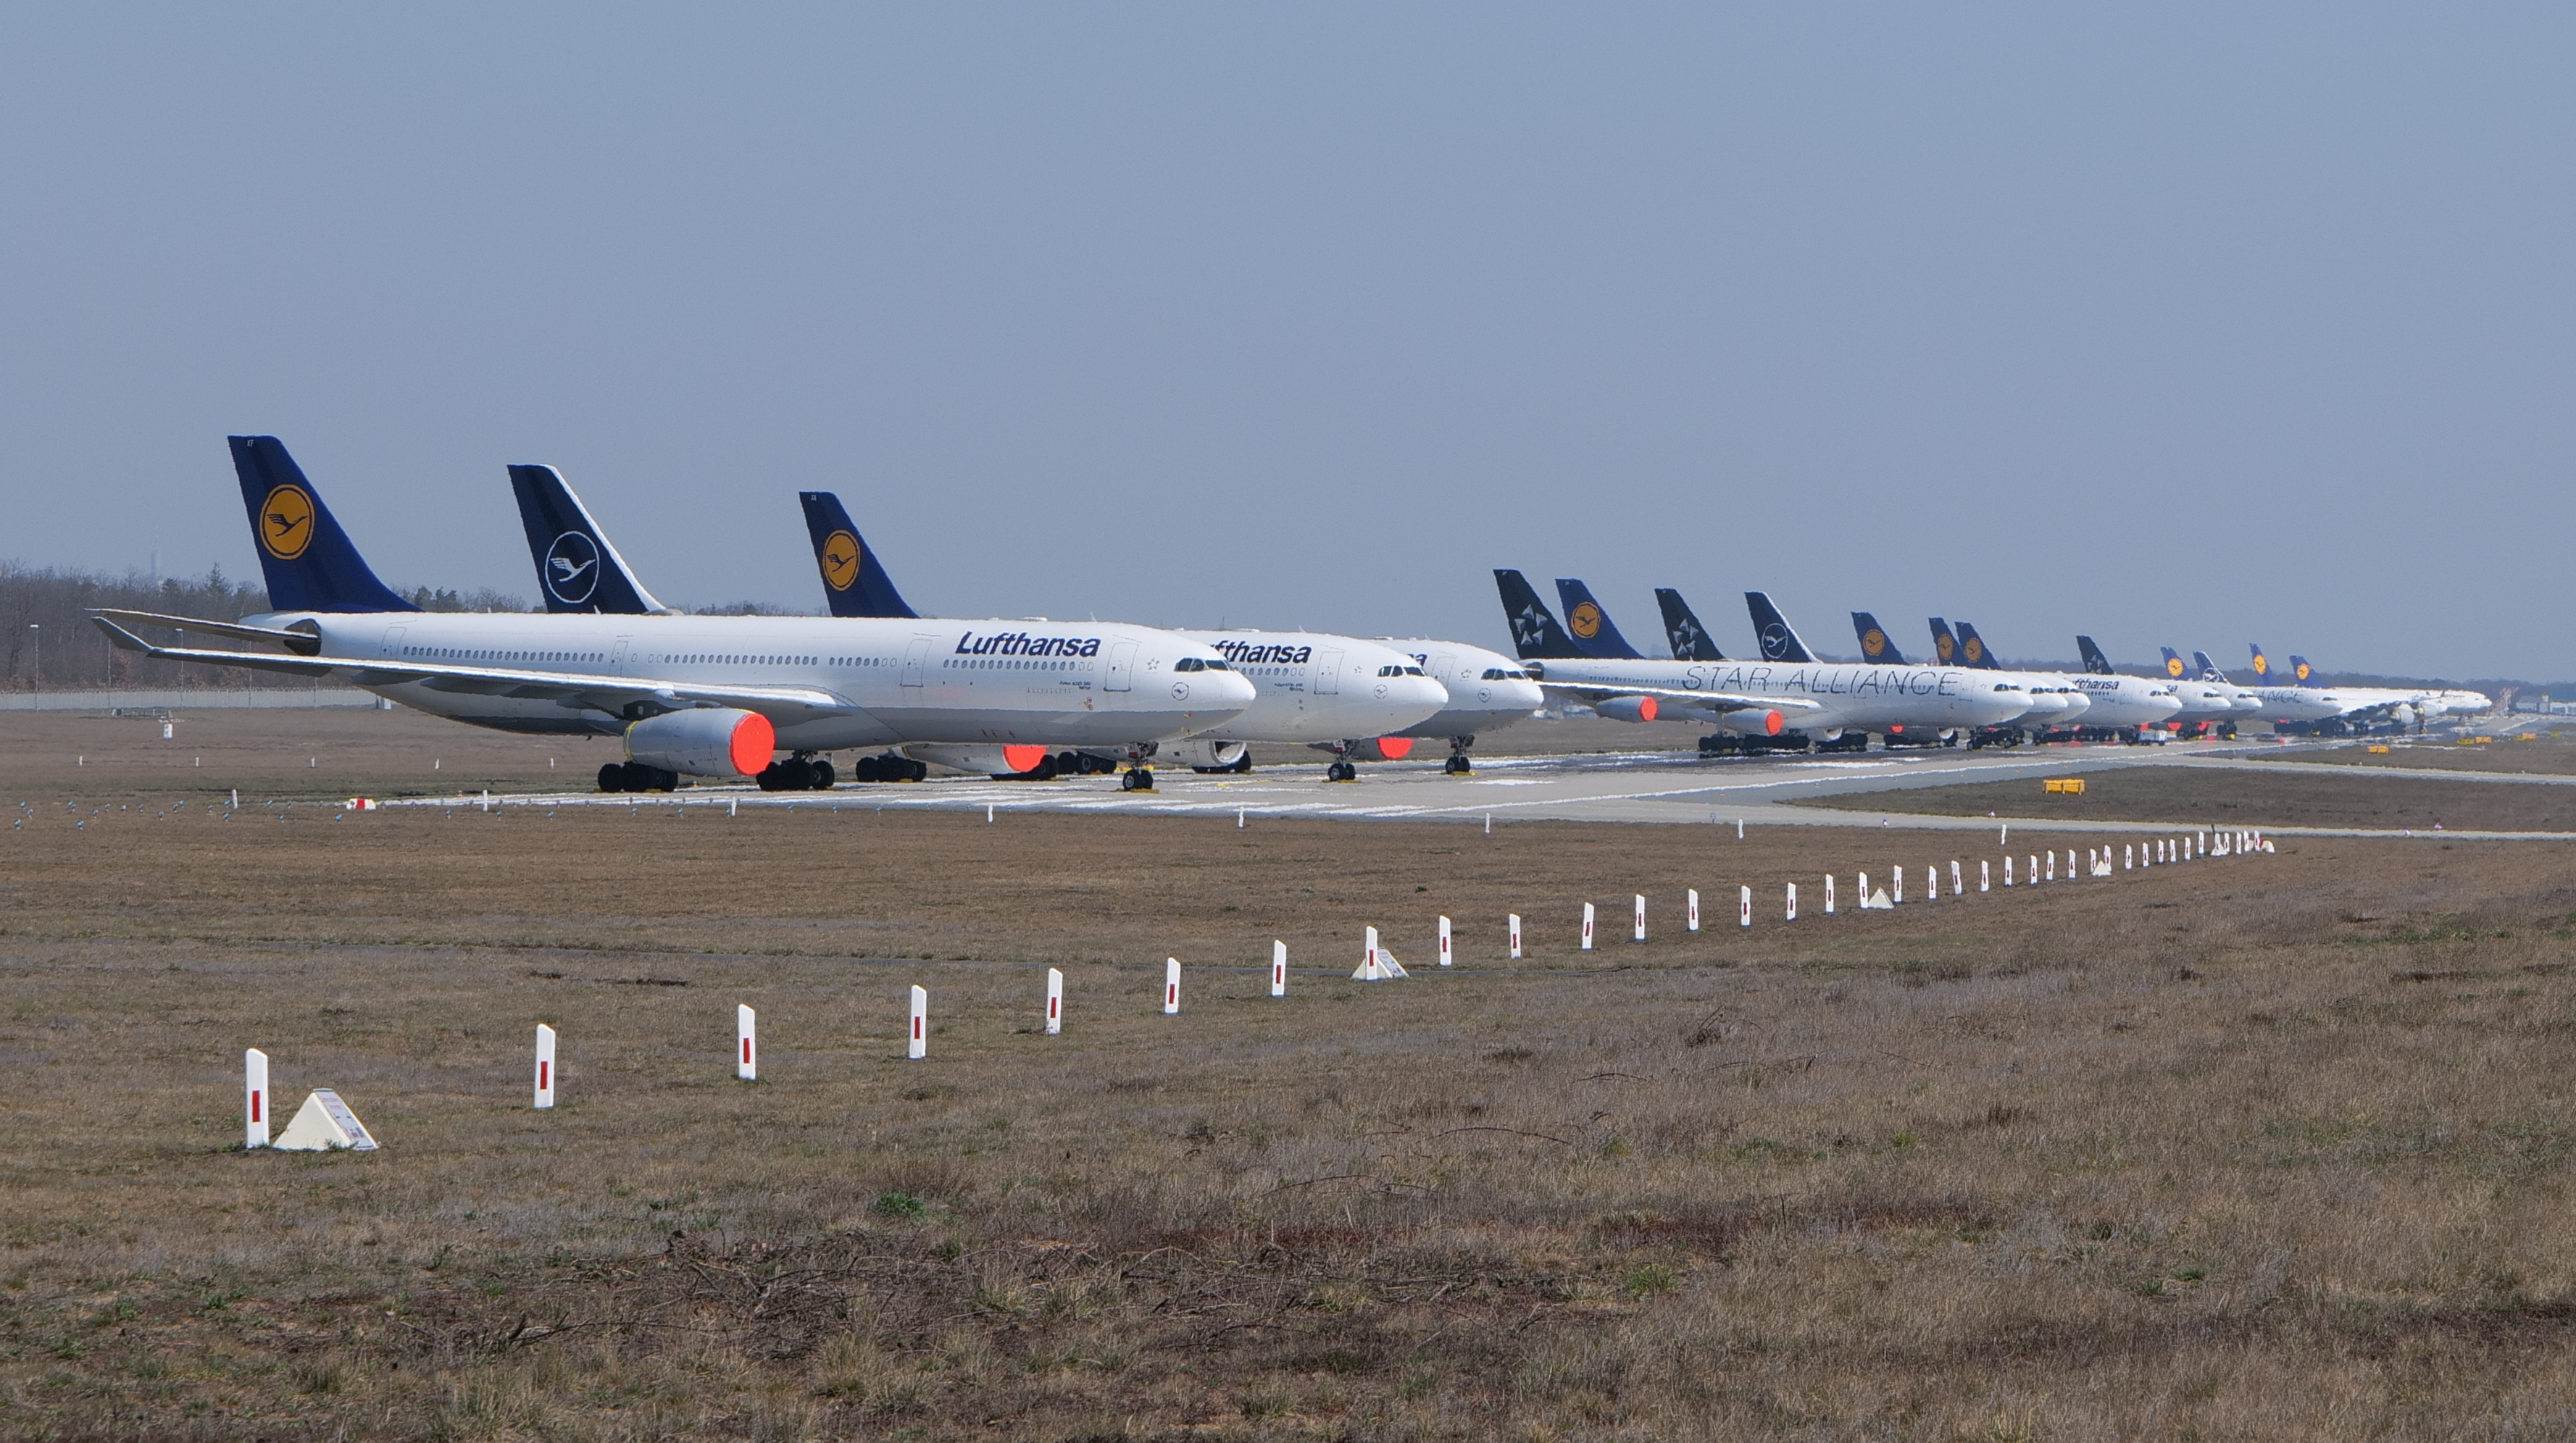
There are many ways to measure COVID’s impact on airlines: The number of flights, seat capacity, or passengers is just a few of them. However, pictures of airports packed with grounded aircraft will indeed remain in the people’s memory.

Besides the emotional factor, the number of grounded aircraft reflects an excellent pandemic indicator. From a global perspective, the number of parked aircraft due to COVID-19 has decreased from 35% in July 2020 to 31% in March 2021. Moreover, once we exclude Europe from the calculation, the numbers look even better: Although the starting in July 2020 remains at 35%, the amount of parked aircraft decreases to 28% in March 2021.
| Jul ’20 | Aug ’20 | Oct ’20 | Nov ’20 | Dec ’20 | Feb ’21 | Mar ’21 | |
|---|---|---|---|---|---|---|---|
| Global | 35% | 33% | 32% | 32% | 31% | 31% | 31% |
| Global (excl. Europe) | 35% | 33% | 31% | 30% | 29% | 28% | 28% |
COVID 3rd Wave Hit European Airlines More Than any Other!
When we look at the detailed numbers, it becomes evident that European airlines —more than any other— suffered from Covid’s third wave.
| Jul ’20 | Aug ’20 | Oct ’20 | Nov ’20 | Dec ’20 | Feb ’21 | Mar ’21 | |
|---|---|---|---|---|---|---|---|
| Asia Pacific | 22% | 22% | 21% | 20% | 20% | 21% | 21% |
| North America | 35% | 35% | 34% | 32% | 32% | 32% | 32% |
| Europe | 33% | 32% | 34% | 43% | 40% | 47% | 43% |
| Latin America | 44% | 38% | 34% | 31% | 28% | 27% | 29% |
| MEA | 41% | 39% | 37% | 36% | 35% | 33% | 31% |
Between July 2020 and February 2021, European airlines grounded more than 1,000 additional aircraft. February was the peak month when European airlines grounded almost 50% of their aircraft fleet.
| Jul ’20 | Aug ’20 | Oct ’20 | Nov ’20 | Dec ’20 | Feb ’21 | Mar ’21 | |
|---|---|---|---|---|---|---|---|
| Europe | 2521 | 2487 | 2600 | 3265 | 3089 | 3536 | 3252 |
[rp4wp]
Other World Regions Outperformed Europe
Moreover, it is interesting to see that no other world region went through a similar development.
- Asia/Pacific remained stable the entire period from July 2020 to March 2021 with a share of parked aircraft of 20%-22%.
- North America reduced the ground fleet from 35% in July 2020 to 32% in November and maintained the status until March 2021.
- Latin America massively and steadily reduced the amount of grounded aircraft from 44% in July 2020 to 29% in March 2021.
- The Middle East and African carriers also reduced the amount of parked aircraft from 41% in July 2020 to 31% in March 2021.

Why European Airlines Suffer From COVID’s 3rd Wave More Than Other Regions
The question remains why Europe and subsequently European airlines suffer from COVID more than any other world region. From our point of view, two explanations are relevant.
First of all, COVID’s 3rd wave hit European countries harder than many other regions. Therefore, it is evident that flight demand decreased during that time. Nevertheless, worth mentioning that other regions and countries (e. g., India or Brazil) were also hit hard. Accordingly, there must be an additional aspect that impacted airlines and sent European aircraft to the parking lot. In our opinion, this is about the share of international flights.
The latest traffic figures show that domestic routes account for the most traffic at the moment. However, European countries have a rather small share of domestic traffic. On the contrary, European airlines built their business model on Intra-European and intercontinental traffic. Accordingly, the business model of European airlines is extremely vulnerable to global crises.
COVID’s 3rd Wave’s Impact on Airlines — What do you Think?
We’re always happy to get your feedback! Leave us a comment or get in touch with the author on social media!
Data sources
This article is based on various data sources: Cirium and internal data sources.


