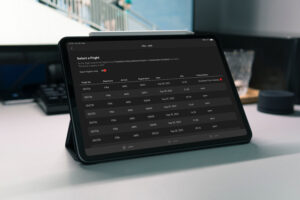
Tableau literally enabled business departments to get in control of their data. And Tableau paved the way for data-driven improvements and enhancements. It filled the void between Excel limitations and database developers and created the world of self-service business intelligence.
Moreover, I think because of the before mentioned and the new possibilities Tableau is providing, people start to think about how and where they can utilize the tool.
Tableau As Real-Time Dashboard — An Frequently Asked Question
I guess that’s why —from time to time— clients or people I talk to ask me, “What about Tableau? Can’t we just use Tableau as a real-time dashboard?”.
When I was confronted with this question for the first time, I was really surprised. I’ve never thought about that use case. Simply because I believe that real-time dashboards and Tableau serve different use cases. Moreover, they are addressing various problems and even user groups.
Nonetheless, we had a more detailed look at that case. Undoubtedly, Tableau brings a vast variety of features to the table. However, there are three essential facts why I think it doesn’t make sense to use Tableau as a real-time dashboard.
And to make this clear again: I don’t think that this is because Tableau is missing specific features. It is because Tableau wasn’t built for this particular use case. So let’s take a look at the details.
Reason #1 — Analytics vs. Situational Awareness
When looking at the Tableau website, one can quickly realize how Tableau positions itself: As an end-to-end analytics platform. And Tableau offers a wide range of functionalities, features, and strengths for this use case.
It’s all about combining data and drilling down into the exact details. It is about identifying the root causes and patterns. Or, to get it straight: A tool to analyze a company’s vast amount of data.
The main focus of a real-time dashboard is quite contrary to the use case Tableau is aiming for. It is not about analysis and digging into the details. Instead, a real-time dashboard seeks to create an unmatchable situational awareness. It is about aggregating data, curating information, and providing a comprehensive view of what is happening.
So first and foremost, Tableau and real-time dashboards aim for entirely different use cases.
Reason #2 — Real-time Calculation
As mentioned in many other blog posts, a real-time dashboard provides real-time data, information, and KPIs. Therefore, it doesn’t make sense to show KPIs and information of the last day or week only.
Most of the benefits and advantages a real-time dashboard brings to the table are tightly linked to its real-time nature. Of course, Tableau is capable of dealing with real-time data. Nonetheless, and similar to reason 1, this is not the primary goal of Tableau. Therefore, the hurdles and challenges to using Tableau as a real-time dashboard are immense.
We had discussions with companies that were trying to achieve that goal with Tableau. Unfortunately, the results they achieved were quite disillusioning. So although it can be possible, it won’t work out-of-the-box and requires considerable effort.
Reason #3 — Certified Corporate KPIs
The last reason addresses the aspect of quality. In this context, one of the most significant advantages of Tableau can turn out as a disadvantage—especially when using Tableau as a corporate-wide real-time dashboard.
Tableau —and this is an unbelievable achievement— re-defined the world of self-service business intelligence. With Tableau, every user, every business department can create reports. On top of that, everybody can analyze data and subsequently define KPIs.
However, this possibility inevitably leads to a decentralized creation of information. And we’ve seen many companies looking at KPIs on five different Tableau dashboards. I’m sure you can imagine the result. Every KPI showed another value.
Indeed, it is possible to establish data governance processes to avoid such situations. However, from experience, I know that this is callous work. This can lead to situations where real-time dashboards show different values for the same KPIs as a negative effect.
Contrary to Tableau, a corporate real-time dashboard requires to defined certified KPIs. That means agreeing on KPIs, its calculation, its dimensions, and its source data. Thereby, you can ensure that these KPIs are shown across all dashboards. This leads to the situation that it doesn’t matter how (mobile, screen, browser) and where (business department, CEO office, etc.) you are using the dashboard. It is simply ensured that you are always accessing the same certified KPIs.
Summarized — Tableau As Real-Time Dashboard
Tableau is a brilliant solution in terms of business intelligence and analytics. It really changed the way companies are dealing with data. Moreover, it created entirely new approaches for self-service business intelligence.
However, based on our experiences, the use case of real-time dashboards is different from the one Tableau is aiming for. Mainly due to the aspects use case, real-time, and certified KPIs.
What’s Your Experience With Tableau And Real-Time Dashboards?
Always happy to receive your feedback and thoughts. Just hit me up on Twitter or get in touch on LinkedIn.


