Even worse, a dashboard that only visualizes KPIs can provide an overview of your current performance but shows enormous limitations when it comes to providing a comprehensive situational awareness.
With this post, we introduce four essential information you should include on your operational dashboard. Additionally, we will also provide examples of how to visualize that information. Moreover, the examples include some best-practices we gathered from our projects and product development.
Airline Operations Information: Departure & Arrival Lists
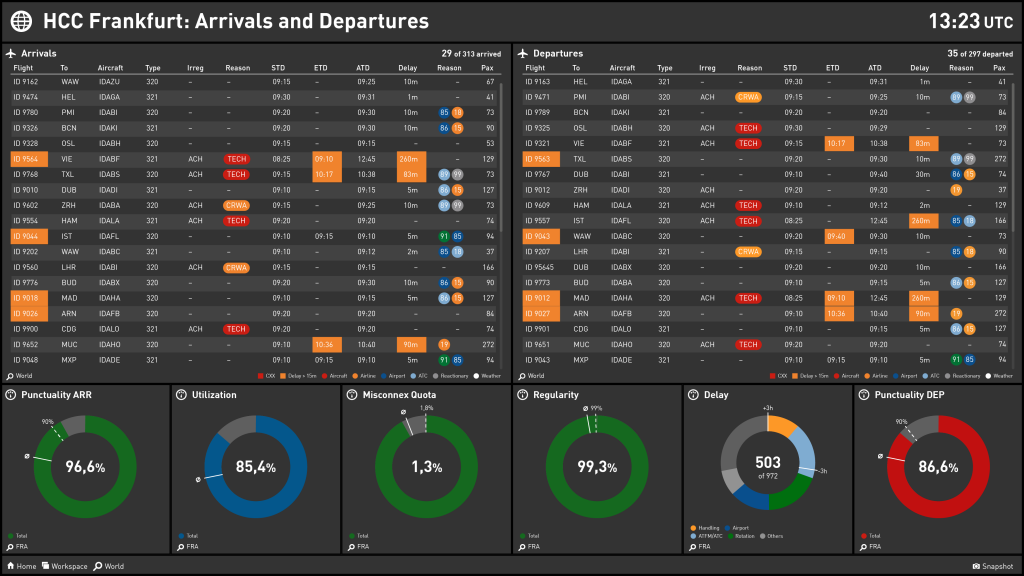
One of the most critical information an operational dashboard has to include is about upcoming arrivals and departures. We like to visualize that kind of information quite traditional in two separate lists. Very often, the lists are tailored to specific airports or even focusing on one single hub only.
However, from our point of view, simply showing a list of flights won’t do the trick. Conversely, there are two critical aspects to consider when visualizing arrival and departure flight lists.
Add useful flight information
Solely showing a flight number doesn’t provide a huge benefit. One crucial advice to enrich the flight list with helpful information. In our example, we are showing attributes, for example, ETA, delay reasons, number of passengers, delay minutes, etc. This helps to assess the status of a flight.
Use color highlighting
Develop a color highlighting concepts that highlight flights according to different rules (specific delay minutes, ground insufficiency, etc.).
This will bring two massive advantages: On the one hand, you can quickly identify single flights with a specific problem, and on the other hand, you can quickly assess the overall situation of your operations according to the overall coloring of the flight list.
With our product, we defined several rules, but all are aiming for the same benefit: In case the flight is mostly black/white, operations run smoothly. In case the dashboard, more and more turns yellow problems start to rise. And if you can spot a lot of red on your dashboard, you are facing massive problems.
Airline Operations Information: World Map

The world map provides an overview of currently operated flights. Of course, in case you are only operating in specific parts of the world, you don’t have to show the entire world map but only required regions. The world map is aiming to provide awareness and status of your current flights.
Besides a perfect overview, we also observed that the world map reflects a considerable asset in terms of emotional motivation. Again, we strongly advise adding additional context to the world map or the shown flights. With our product, we again use colors to provide further information.
Usually, our clients go for a color highlighting visualizing if flights are on-time or delayed (initially according to departure and as soon as an ETA is available according to arrival). Green flights are on-time; red ones are delayed. But we also have different use cases: For example, coloring according to the number of connex passengers.
Airline Operations Information: Weather Overview

We already discussed the importance of weather information for airlines with one of our last posts. Especially when it comes to medium and long-haul operations, the importance of accurate weather information is enormous. Since there are many providers for weather data (METAR, TAF), it is relatively easy to integrate this kind of information.
The challenge we observed is in translating the information (METAR and TAF are quite cryptic for many people). That’s why we put a lot of effort into visualizing the text-based information. Additionally, to avoid an information overflow, it makes sense to pay attention to highlighting specific aspects (exceptional winds, clouds, thunderstorms, etc.)
Below you can see an example of how translated and visualized weather information in the context of the aWall look.
Airline Operations Information: Airport Information

Last but not least, we strongly advise to include airport information within your operational dashboard. From our point of view, this should include information about current aircraft at an airport and their position.
Similar to world maps and flight lists, it makes sense to include additional information on flights. And again, use color highlighting to highlight problem-related aircraft. Additionally, you can add airport-specific information, for example, runways usage and closure.